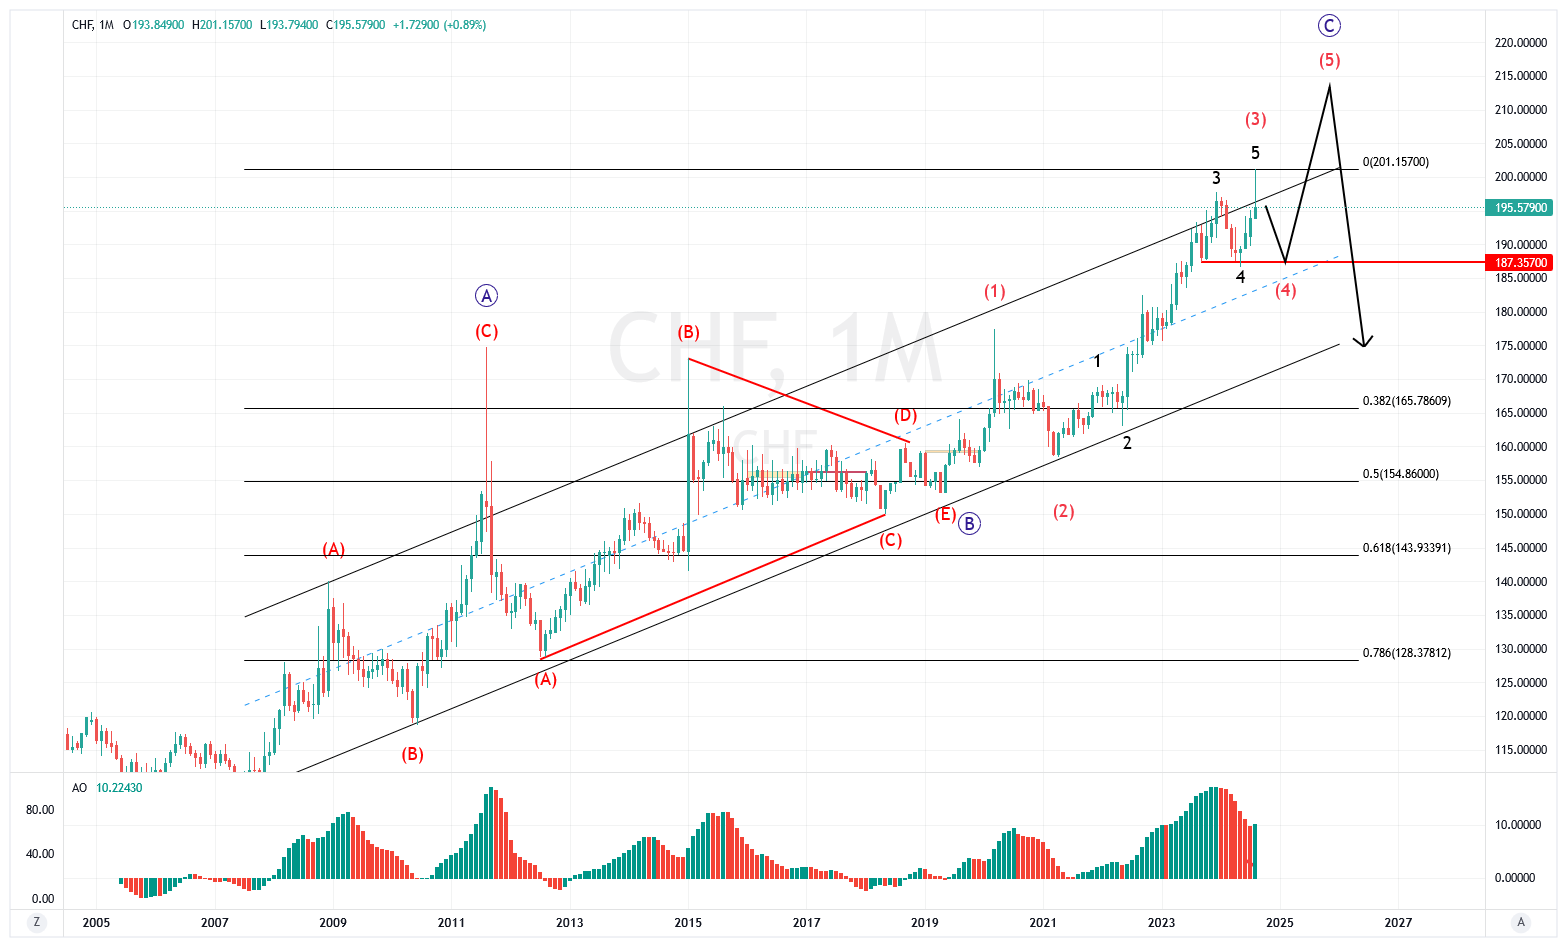

Main Elliott Wave count of CHF currency basket against 16 other currencies (EUR, USD, GBP, CHF, JPY, CAD, AUD, NZD, CNH, DKK, MXN, NOK, PLN, SEK, SGD, ZAR, TRY).
Monthly Chart
As I have been arguing for about a year now, CHF seems to be at the very end of a multiyear rising channel anchored back in 2007. In addition, due to the repeated overlaps I do not subscribe to the idea of counting this move up as an impulse. However, “being at the very end” does not necessarily mean being immediately close to e.g. a reversal.
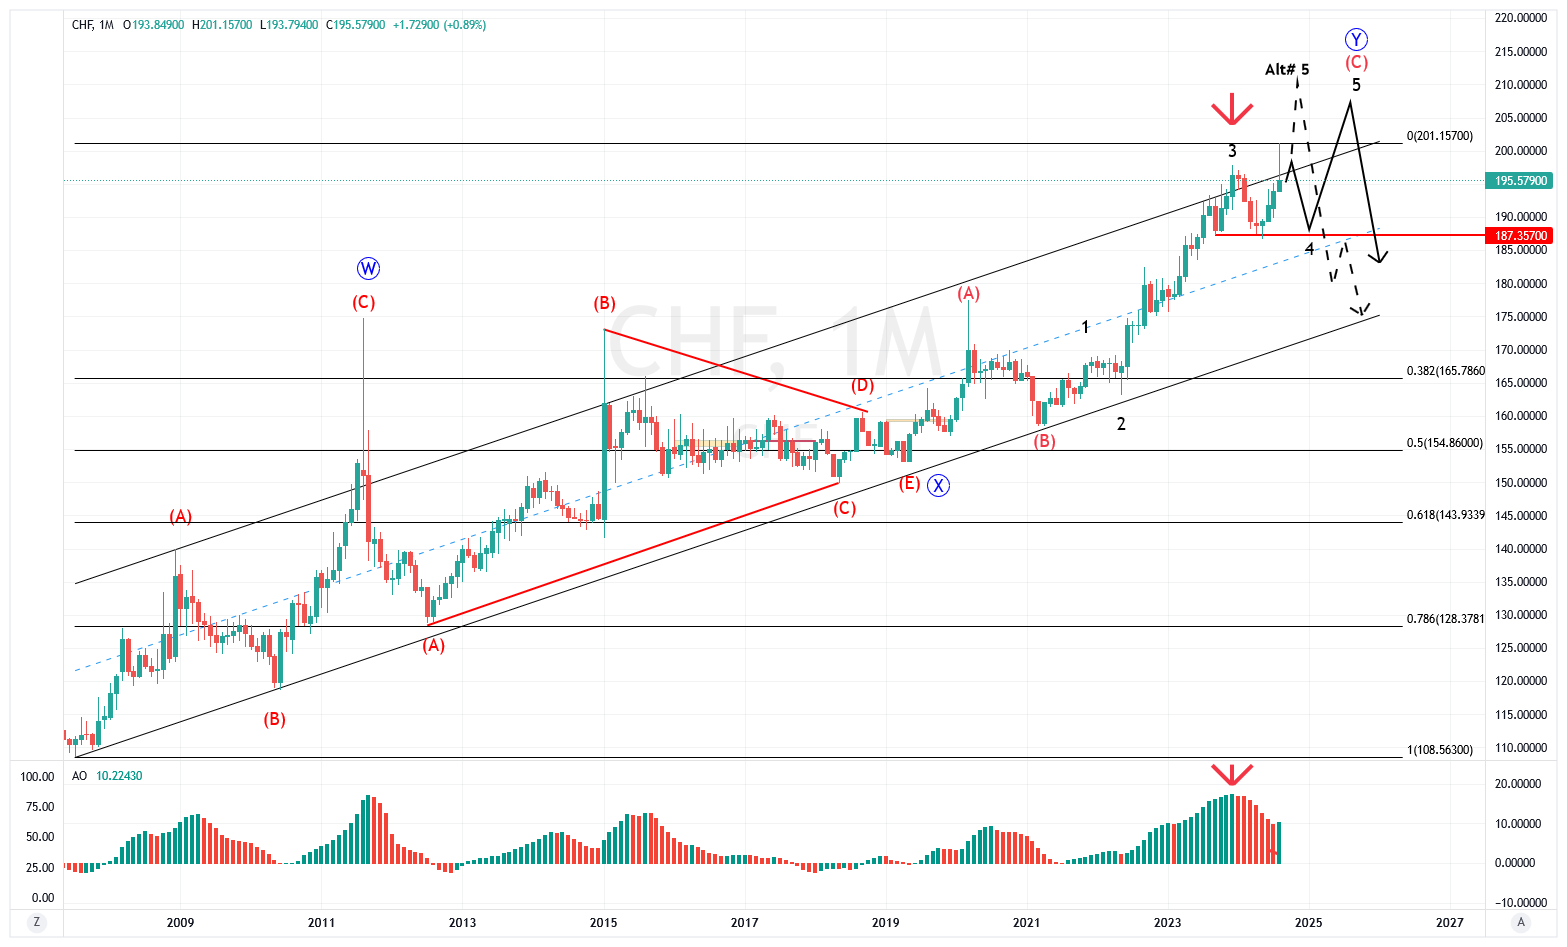
The monthly chart teaches patience as it shows that a topping (and bottoming) process may take some time to form its structure. The history of price action shows that CHF likes to top with a spiky pin candle, a bit shorter in the first (A-wave) and longer in the third (C-wave). That is not what I see here so far and it is still too early to draw a conclusion for the month.
One thing clear though. When the Dec-23 high (red arrows) had to succumb to yet another high, but without repeating the same AO block pattern, it confirmed with almost 100% certainty a subwave 3 to be in place of the ongoing wave of larger degree. Due to the internal structure of the subwaves, I no longer think we have seen the final high formed.
In my view, the most likely price development from here over the coming months is a retest of support (red horizontal line) to form wave C of a flat. Then we may see the final high later in 2025.
Alternatively, we could also see price rising sharply from here and quickly come down again before end of month. While I think the former is somewhat more likely to transpire, in fact I do see both these scenarios as quite equally balanced.
Weekly chart
Last week saw CHF spike higher and then rapidly come down. While I do not argue with the possibility that this can be the high, I do see some problems with this take. To begin with, I can only count 3 subwaves up from the low of this wave. That would make it a B-wave rather than a final wave 5 in 5 subwaves.
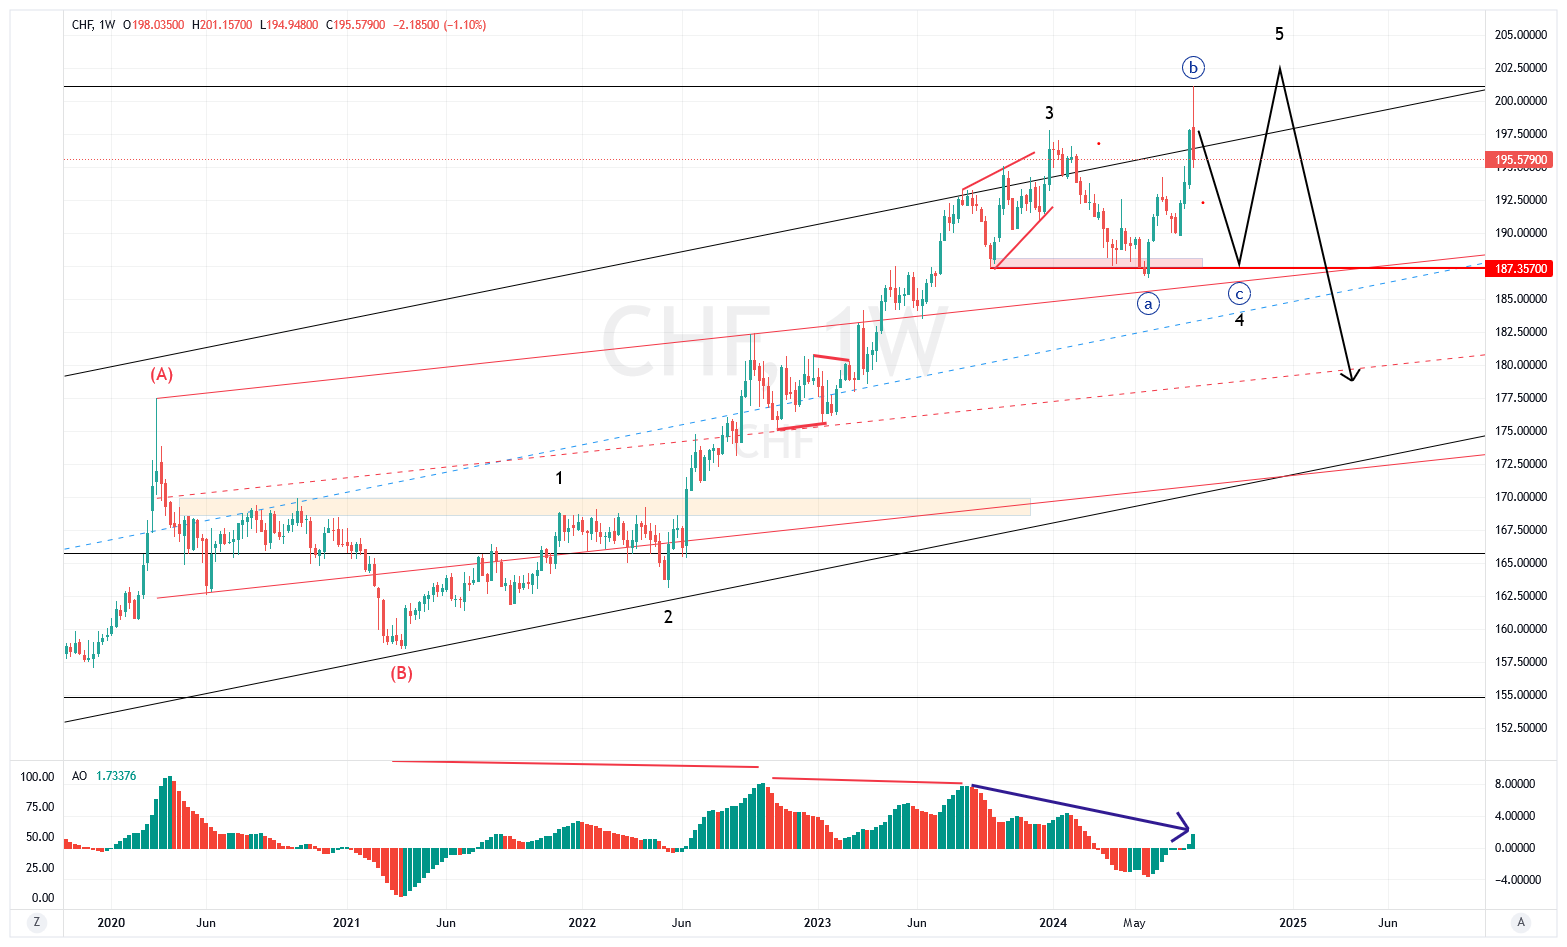
In addition, while the last AO block is tiny and show divergence at this stage, it is all green and rising. Therefore, for now I will stick to this as my main count.
However, if price does not continue to drop next week but stays sideways or even start to rise. Then we more seriously need to start contemplate that wave 4 already has completed with a sharp ZZ correction and price now may spike up in wave 5 as in the weekly chart below.
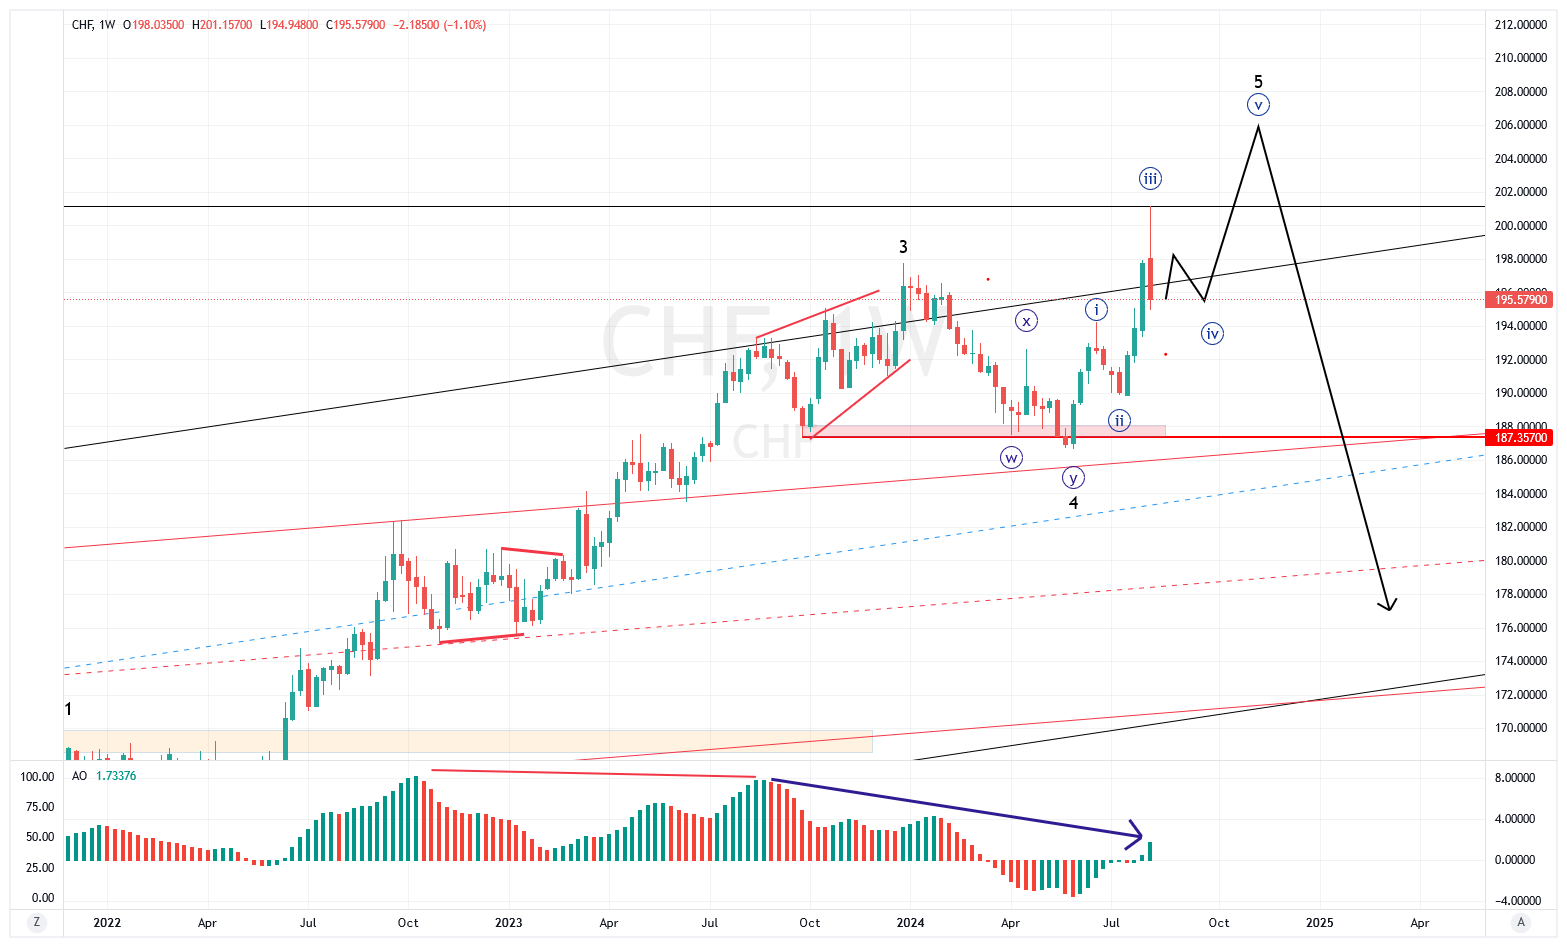
In fact, looking at the Daily chart there are indications that this may be what is happening, even if it so far only is a possibility rather than a probability; we have a higher high both in price and on the AO blocks. Further, if we draw a channel based on the first two waves we can see that price reached far outside of it, even if it then came back in again. This often significates a wave 3 rather than C.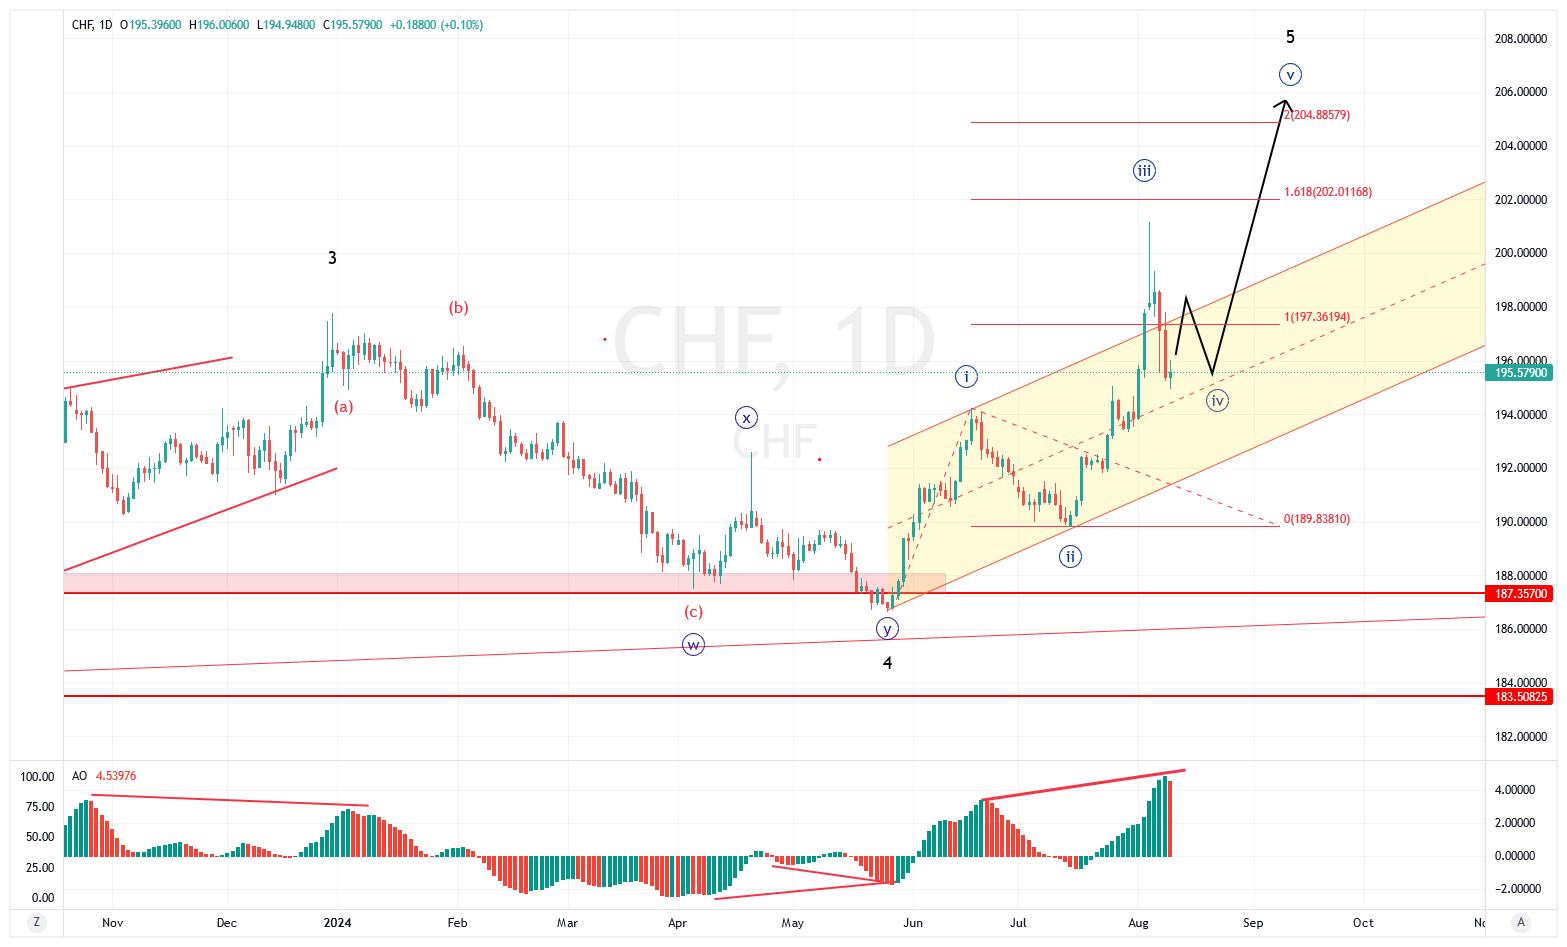
The one thing that talks against this is that the supposed wave 3 didn't reach all the way to being 1.618 times longer than wave 1. It's the longest wave so far though so now EW rule has been broken.
Conclusion
As CHF is highly sensitive to geopolitical issues, among other things, which may spark risk-off flows, and with the current situation of uncertainty in the Middle East, I think it is wise to wait and see before getting involved with this currency now.
In addition, while the current trend certainly is up, it is also topping but this can still take some time. Once the top is in place, we can however expect a longer period of weakness. Much longer than the 4 months, we have seen recently and at least down to the bottom of the monthly channel.
Alternative Monthly Count (Alt#)
The alternative count here is to replace the larger WXY pattern with a more plain ABC correction and get a more accentuated 5 waves substructure in the last wave. At the current stage, there is not much of a different for the outcome, which is why I still stick to my original count. However, if price was to go much higher from here, especially after a test of support, then this count may become more appropriate.