To differentiate a market movement is necessary to segregate the different waves. The price channelling allows us to identify each wave while the market progresses. In this article, we will discuss how we can use channels to ease waves identification.
The First Channel
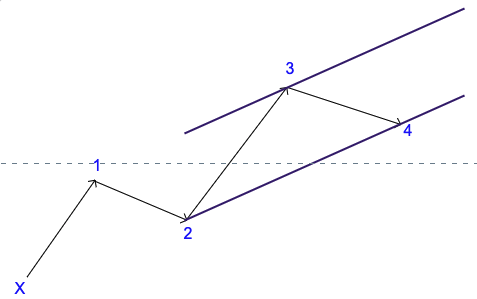
Let’s consider a motive movement starting at level X. The price began to move in a first wave, Wave 1. After the first wave completion, the price retraces in Wave 2. Remember that the main condition to trace the first channel is the completion of Wave 2.
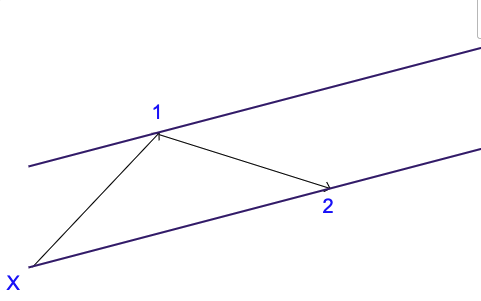
When the second wave has finished, we can trace the base of the channel (or lower line) connecting the origin X with the end of Wave 2. After this, we trace the upper line of the channel starting at the end of Wave 1. The upper line projection establishes the end of Wave 3.
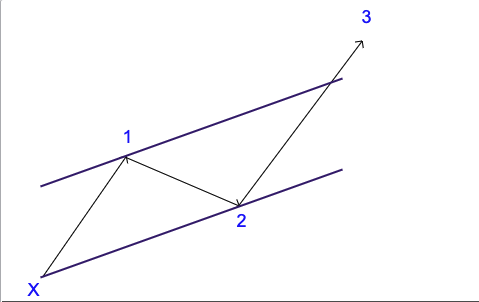
The Second Channel
After Wave 3 has finished, we trace the second channel. In this case, we must connect the upper line at the end of Waves 1 and 3. The projection of the lower line is at the end of Wave 2.
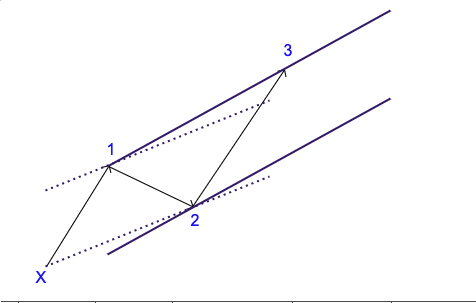
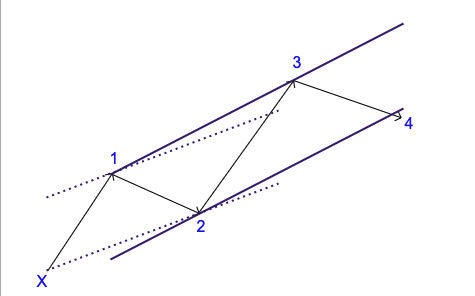
The target is Wave 4. Remember the rule “Wave 4 never retrace the Wave 3 completely.”
The Last Channel
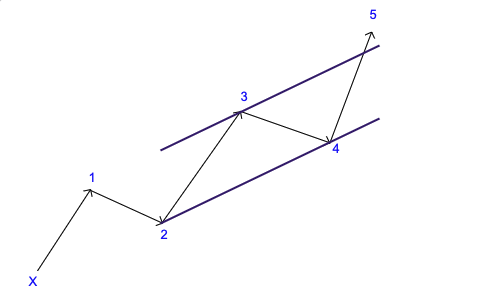
The last channel will drive us to the potential end of the fifth wave. The tracing procedure is like the previous two steps, but for simplification, we will erase the two last channels. In this case, we connect the baseline at the end of waves 2 and 4 and then project the upper line at the end of Wave 3.
The potential target of Wave 5 should be the upper line of the channel.
Putting All Together
Previous idealizations are illustrative, but let’s now apply it in different markets. The example corresponds to the Soybean (S) daily chart. We observe a bullish cycle that started when the price found a bottom at $1,094.2. For convenience, we identify the origin with an ‘X.’ After the second wave completion, we trace the first channel connecting X with the end of Wave 2. Moreover, the upper line is projected at the end of Wave 1.
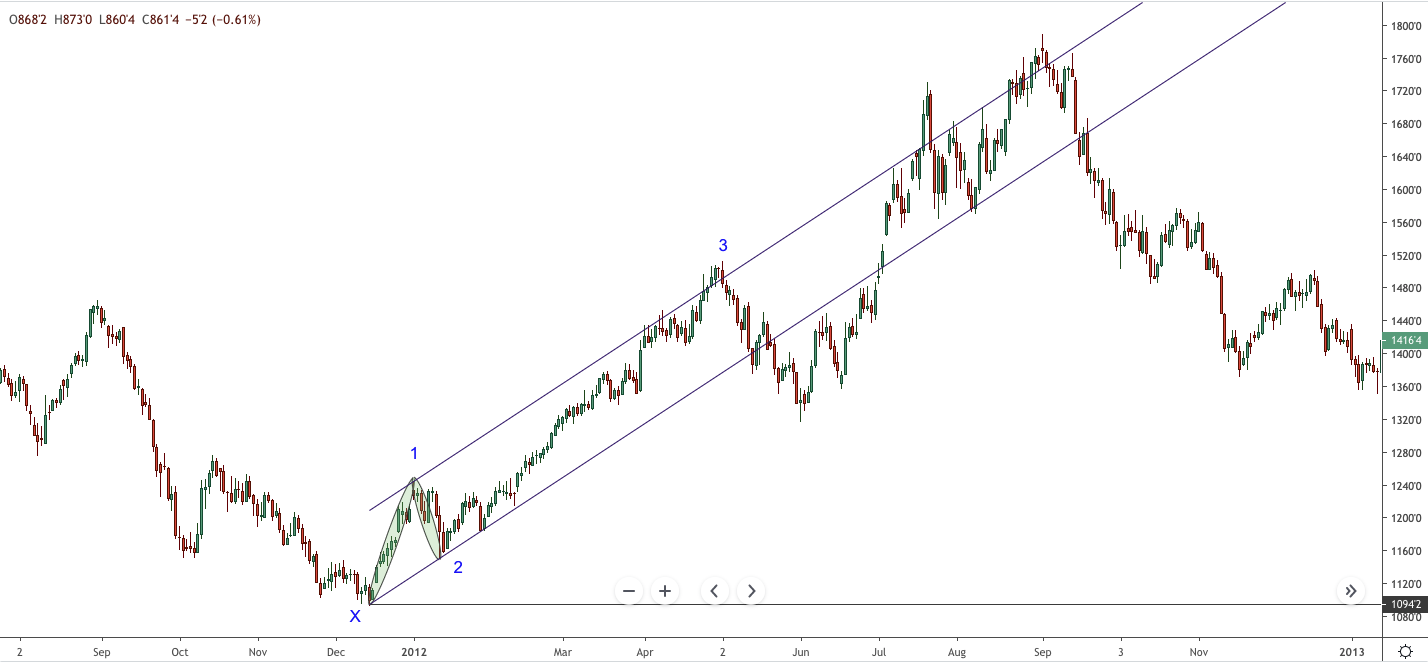
Once Wave 3 has finished, we trace the second channel connecting the end of waves 1 and 3. The projection is at the end of Wave 2. The price action shows that Wave 4 finishes below the lower line, and don’t retrace completely Wave 3.
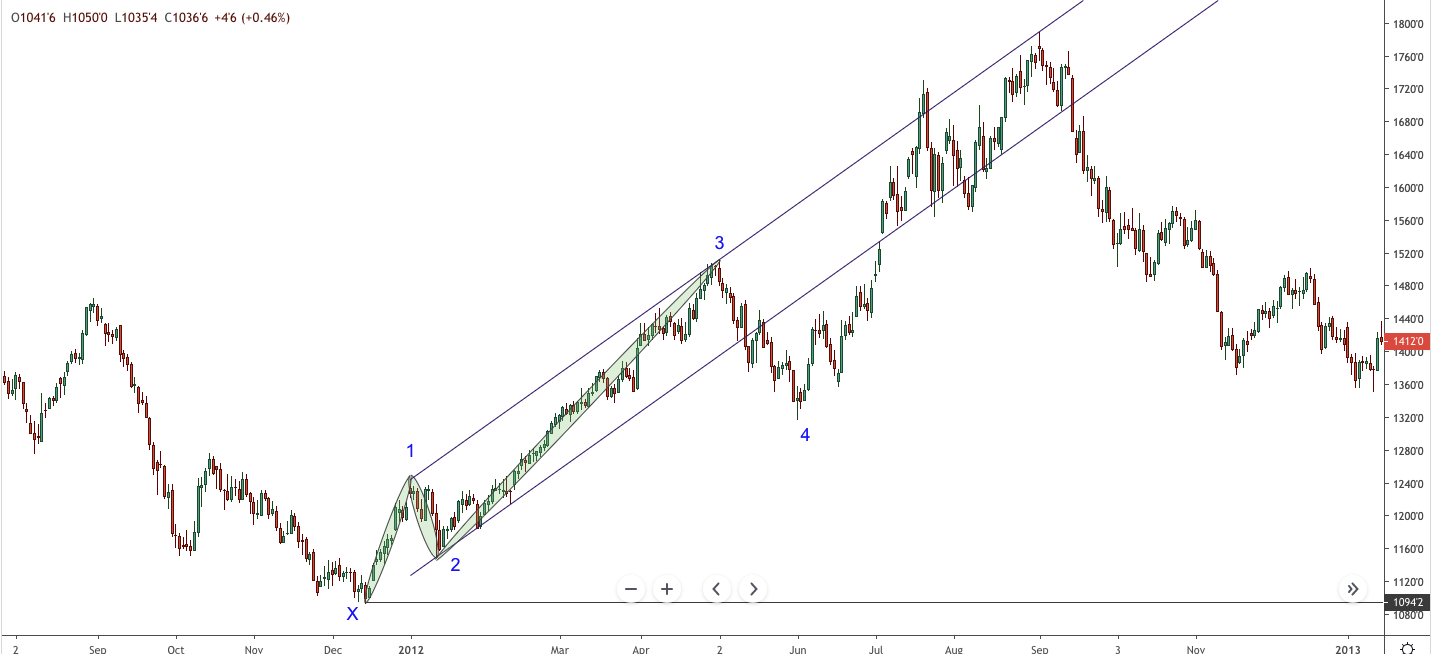
Finally, we trace the last channel connecting the end of Waves 2 and 4 and project it at the end of Wave 3. This new channel can provide us with information about the fifth wave ending.
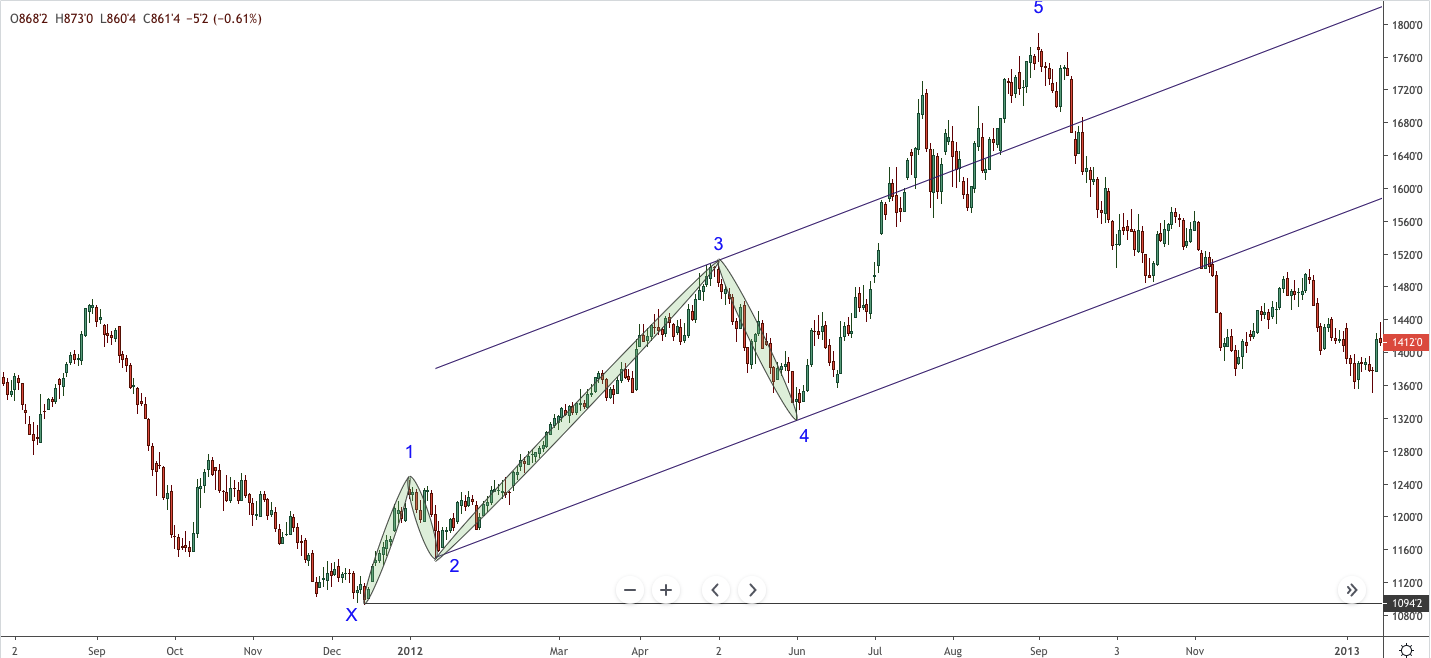
In conclusion, channels are a useful tool to support wave analysis. In particular, channels allow us to identify each part of the movement. In our next article, we will discuss the Waves Terminology and Labeling.
CONTENT OF ELLIOTT WAVE CHEAT SHEETS
1 Home Rules and Guidelines Applicable to All Motive and Corrective Waves
2 Wave 1 Characteristics and Structure
3 Wave 2 Characteristics and Structure
4 Wave 3 Characteristics and Structure
5 Wave 4 Characteristics and Structure
6 Wave 5 Characteristics and Structure
7 Wave A Characteristics and Structure
8 Wave B Characteristics and Structure
9 Wave C Characteristics and Structure
10 Extensions Structure and Trading
11 Fibonacci Targets Price Targets for Retracement and Extension
12 1-2/1-2 Structures Wave 1-2 /1-2 Characteristics
13 Zigzags Structure and characteristics
14 Flats This is All FLAT Rules
15 Triangles Triangles (3-3-3-3-3) Description and samples
16 Complex Corrections Characteristics of Complex Corrections (Combinations)
17 Declaring X Waves When to declare an X wave and a complex correction
18 Ending Diagonals Description and samples.
19 Leading Diagonals Description and samples. This is quite rare.
21 Channeling How to Use Channels to Identify Waves
22 Correction Times Use the appropriate time frame to analyze the correction.
